Revenue per Mille (RPM) is one of the most useful ad metrics for publishers who want to understand how well their website actually monetizes its traffic.
The idea is simple: RPM tells you how much revenue you generate for every 1000 page views or ad impressions, depending on which type of RPM you are looking at. That makes it much easier to compare performance than looking at total revenue alone.
After all, earning $500 from a website does not tell you much by itself. If that revenue came from 50,000 page views, the result looks very different from earning the same $500 from 500,000 page views.
That is where RPM becomes useful. It puts ad revenue and traffic into the same frame of reference.
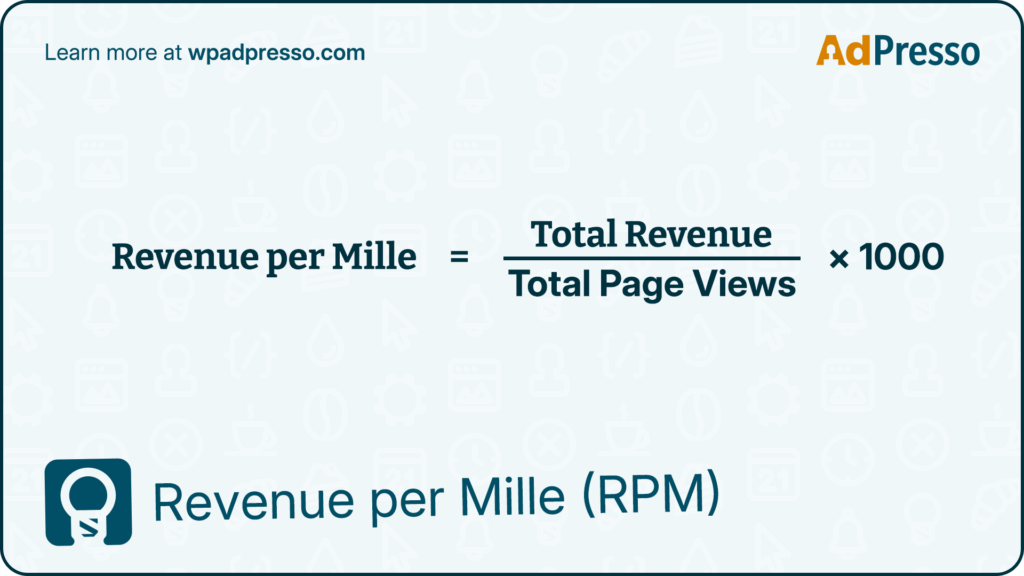
The basic calculation is straightforward. To calculate Page RPM, divide your total revenue by the number of page views and multiply the result by 1,000.
Page RPM = (Total Revenue ÷ Total Page Views) × 1,000
For example, imagine your website generated $450 from 150,000 page views during one month:
Page RPM = ($450 ÷ 150,000) × 1,000 = $3.00
In other words, your site generated an average of $3 for every 1,000 page views.
This does not mean that every 1,000 page views actually produced exactly $3. RPM is an average. Some pages may generate considerably more revenue than others, and revenue can fluctuate significantly depending on traffic source, device, geography, advertiser demand, seasonality, and ad setup.
Total revenue tells you how much money your website made. RPM tells you how efficiently that revenue was generated relative to your traffic. That distinction becomes particularly useful when you are testing changes to your ad monetization setup.
Imagine your traffic increases by 30%, but your revenue only increases by 10%. At first glance, that sounds like good news. Your site is making more money, after all. But your RPM has actually fallen.
That could indicate the additional visitors are less valuable, your traffic mix has changed, or your ad setup isn't monetizing the extra page views as effectively.
RPM can help you spot these changes.
It is particularly useful for:
Think of RPM as a diagnostic metric rather than a magic score. A rising RPM is usually encouraging, but you still need to understand why it changed.
This is where publisher dashboards can get confusing. The word RPM is used for several related metrics, but the denominator matters.
Page RPM measures revenue per 1,000 page views. It gives you a site-level or page-level view of how much revenue your traffic generates.
Impression RPM, sometimes referred to as eCPM, measures revenue per 1,000 ad impressions. It focuses on the performance of the ad inventory itself rather than the number of pages viewed.
The difference is important.
Imagine a visitor loads an article containing four ad placements. One page view can therefore create several ad impressions. Page RPM looks at the value of the page view. Impression RPM looks at the value of the individual ad impressions.
That means the two numbers can move in different directions.
A publisher could have strong impression RPM but a relatively modest Page RPM if visitors generate few ad impressions per session. The opposite can also happen when a site generates several monetized impressions from each page view.
For that reason, it is better to use the metric that matches the question you are trying to answer.
There is no single RPM optimization trick that works for every website. In practice, publishers usually improve RPM by working on several parts of the monetization setup at the same time.
Display advertising does not have to be your only source of revenue. Depending on your content and audience, you might combine programmatic advertising with affiliate marketing, sponsored content, direct advertising deals, or other commercial partnerships.
The important part is ad relevance. Adding another revenue stream just because it exists doesn't automatically improve your business. A well-placed affiliate recommendation can add real value. A completely unrelated widget can just create more clutter.
Look at your content and ask where another monetization method genuinely fits the reader journey.
If you are running programmatic advertising, your estimated revenue depends partly on how much competition exists for your available inventory.
Header bidding and other auction-based setups let multiple demand sources compete for an impression rather than relying on a single source. When implemented correctly, this can improve yield by giving buyers more opportunities to bid on your inventory.
But more demand does not automatically mean higher RPM. Auction configuration, floor prices, fees, latency, traffic quality, viewability, and the actual demand available for your audience all matter.
The goal is not to add as many demand partners as possible. It is to create a setup where the right demand can compete efficiently.
Two websites can have exactly the same number of page views and completely different RPMs.
Geography is one reason. Advertisers generally place different values on audiences in different markets, and Tier-1 traffic from countries such as the US, UK, Canada, and Australia can often attract stronger demand than traffic from lower-value markets.
But geography is only part of the story.
User intent matters too. Someone reading an article about a specific software product may be more commercially valuable to advertisers than someone casually browsing viral entertainment content.
This is why publishers should look beyond traffic volume. A million low-value page views are not necessarily better than 100,000 highly monetizable ones.
Your ad layout directly affects how much of your available inventory users actually see.
An ad placed where readers never reach has little chance of generating revenue. On the other hand, filling every available space with advertising can damage readability and user experience.
The sweet spot is a layout that gives important ad placements enough visibility without turning the page into an obstacle course.
For content-heavy WordPress sites, this often means testing placements before or after content, in-content positions, sticky formats, and other placements that naturally fit the page structure.
Viewability matters here. The goal is not simply to create more ad slots. It is to create ad opportunities that users can actually see.
Different formats can produce very different results because they create different levels of visibility and advertiser demand.
Depending on your website and demand partners, formats worth testing may include:
There is an important caveat here: the format with the highest theoretical estimated earnings is not automatically the best choice.
A high-impact ad that annoys visitors can increase short-term yield while hurting engagement and long-term traffic. RPM should therefore always be evaluated alongside user experience.
Ad refresh can create additional impressions when a user remains on a page long enough for an existing ad slot to refresh.
For publishers with engaged audiences, this can increase the number of monetized impressions generated during a session without requiring additional page views.
However, refresh should never be treated as a simple switch that automatically increases revenue. Refresh behavior must comply with the requirements of the relevant ad partners and be based on meaningful conditions such as viewability and time in view.
If refresh generates impressions that nobody actually sees, you are not necessarily improving monetization. You are simply creating more inventory.
Content quality matters for RPM, but not because longer articles automatically produce more revenue.
A 5,000-word article is not inherently more valuable to advertisers than a well-written 1,200-word article.
What matters is whether the content attracts the right audience, satisfies search intent, keeps visitors engaged, and creates sensible monetization opportunities.
Long-form content can help when it genuinely gives readers more reasons to stay, scroll, and explore additional pages. It can also create natural opportunities for in-content advertising.
But adding words just to create more ad slots is usually the wrong approach.
For publishers, the better question is: Does this content attract an audience that advertisers actually want to reach?
Advertising is only useful when the page and its ad inventory actually load and remain usable.
A slow website can hurt the overall monetization experience through weaker user engagement, lower viewability, delayed ad rendering, and shorter sessions. Heavy third-party scripts can make the problem worse. This is especially true on mobile, where connection quality and device performance vary widely.
Watch Core Web Vitals, ad-related scripts, lazy loading, layout stability, and the number of third-party requests running on your pages. The goal is not to strip your website down until advertising disappears. It is to make sure your monetization stack works with your website rather than against it.
This is probably the question every publisher asks eventually: What should my RPM actually be? Unfortunately, there is no universal answer.
Publicly reported benchmarks show just how wide the range can be. Some sources put average website Page RPM in the low single digits, while well-optimized sites with predominantly Tier-1 traffic can reach the mid-teens or higher. Individual publisher reports also show that strong RPMs are possible in niches such as food, finance, technology, and other commercially valuable areas.
That makes a table such as “travel = 10–25” or “finance = 30–80” look more authoritative than the underlying data really is.
A more useful way to think about RPM is in broad ranges:
| Page RPM | What it can indicate |
|---|---|
| Below $2 | Often seen with low-value traffic, broad international audiences, or weak monetization setups |
| 2-5 | A common range for many general or mixed-traffic websites |
| 5-10 | Solid performance for many informational publishers |
| 10-20 | Strong, particularly with valuable traffic and a well-optimized ad setup |
| $20+ | Possible for highly monetizable traffic, premium setups, or strong commercial niches, but not a universal benchmark |
Treat these figures as orientation points, not industry standards. Current publisher data shows that geography, niche, traffic quality, ad setup, and seasonality can move RPM substantially.
A food publisher with predominantly US traffic, for example, can report a Page RPM above $20, while another site in the same broad category may earn only a few dollars. That does not automatically mean one publisher has a better website. Their traffic, audience, monetization stack, and user behavior may be completely different.
So instead of asking whether your RPM is “good” in isolation, compare it against your own historical performance and against websites with a genuinely comparable audience.
A high RPM sounds great, but RPM alone does not pay the bills.
Imagine two publishers:
Publisher A generates approximately $5,000 at that RPM. Publisher B generates approximately $600. The lesson is simple: RPM and traffic volume work together.
That is why publishers should avoid optimizing for RPM at any cost. If a more aggressive ad setup increases RPM by 20% but causes traffic or page views to fall by 30%, the overall result may actually be worse.
The best monetization strategy balances yield, traffic, engagement, and user experience.
RPM is powerful, but it does not tell you everything.
First, RPM is a revenue metric, not a profit metric. Hosting, advertising technology, agency fees, traffic acquisition, payment processing, and other operating costs are not necessarily reflected in the number.
Second, RPM does not tell you whether visitors enjoyed the page. A publisher can temporarily increase revenue with more aggressive advertising while making the site harder to use.
Third, RPM does not measure a visitor's long-term value. A returning reader may generate little revenue from one page view but become a valuable audience member over months or years.
Finally, RPM can hide important differences between pages. Your homepage, evergreen guides, product reviews, and breaking news articles may have completely different monetization profiles. That is why experienced publishers rarely look at one RPM number and call it a day. They segment it.
Look at RPM by device, country, traffic source, content type, page template, and time period. Those comparisons are often much more useful than a single site-wide average.
There is no universal “good” Page RPM. Many general websites operate in the low single digits, while well-optimized sites with valuable Tier-1 traffic can reach $10, $20, or considerably more. The right benchmark is the one that makes sense for your traffic and business model. Compare your RPM with similar traffic and, most importantly, monitor how it changes over time.
RPM can be influenced by traffic geography, advertiser demand, content niche, user intent, device type, ad placement, viewability, fill rate, seasonality, traffic source, and the number and type of monetized impressions generated per page view. Q4 can also look very different from Q1 because advertiser budgets and auction demand change throughout the year.
Page RPM measures revenue generated per 1,000 page views. It helps you understand how effectively your website turns page views into revenue.
The standard formula is: Page RPM = (Revenue ÷ Page Views) × 1,000
No. CPM describes the amount advertisers pay for 1,000 ad impressions. RPM describes how much revenue the publisher generates per 1,000 units of traffic or inventory, depending on the RPM definition being used.
You need both. Increasing traffic gives you more opportunities to generate revenue. Increasing RPM means you earn more from each 1,000 page views.