The click-through rate (CTR) is a fundamental yet challenging metric in online marketing. It quantifies how often an ad unit or call-to-action element, displayed for an audience, successfully prompts a click. Calculated as clicks divided by total impressions, CTR directly gauges your content's immediate appeal.
Historically, click-through rates have plummeted. While 1994's first online ad saw an astonishing 44% CTR, today many formats yield only 0.2-0.3%. This dramatic decline reflects the internet's maturation and the pervasive "ad blindness" from user sophistication.
Despite this sobering shift, click-through rate remains a vital indicator of engagement. Yet, a high CTR doesn't guarantee high conversions; users often click out of curiosity. A truly insightful analysis pairs CTR with metrics like conversion rate. This article will guide you through the entire click-through rate topic, including CTR calculation, benchmarks, and optimization strategies.
Let's get down to the brass tacks of click-through rate (CTR). It's precisely the ratio of clicks a specific link gets to the total number of times that link, page, email, or ad is displayed—we call these impressions. And yes, it's presented as a percentage. For a comprehensive understanding of all technical terms in online marketing and ad tech, please consult our ad glossary.
The calculation is straightforward: CTR= (number of clicks / number of impressions)×100
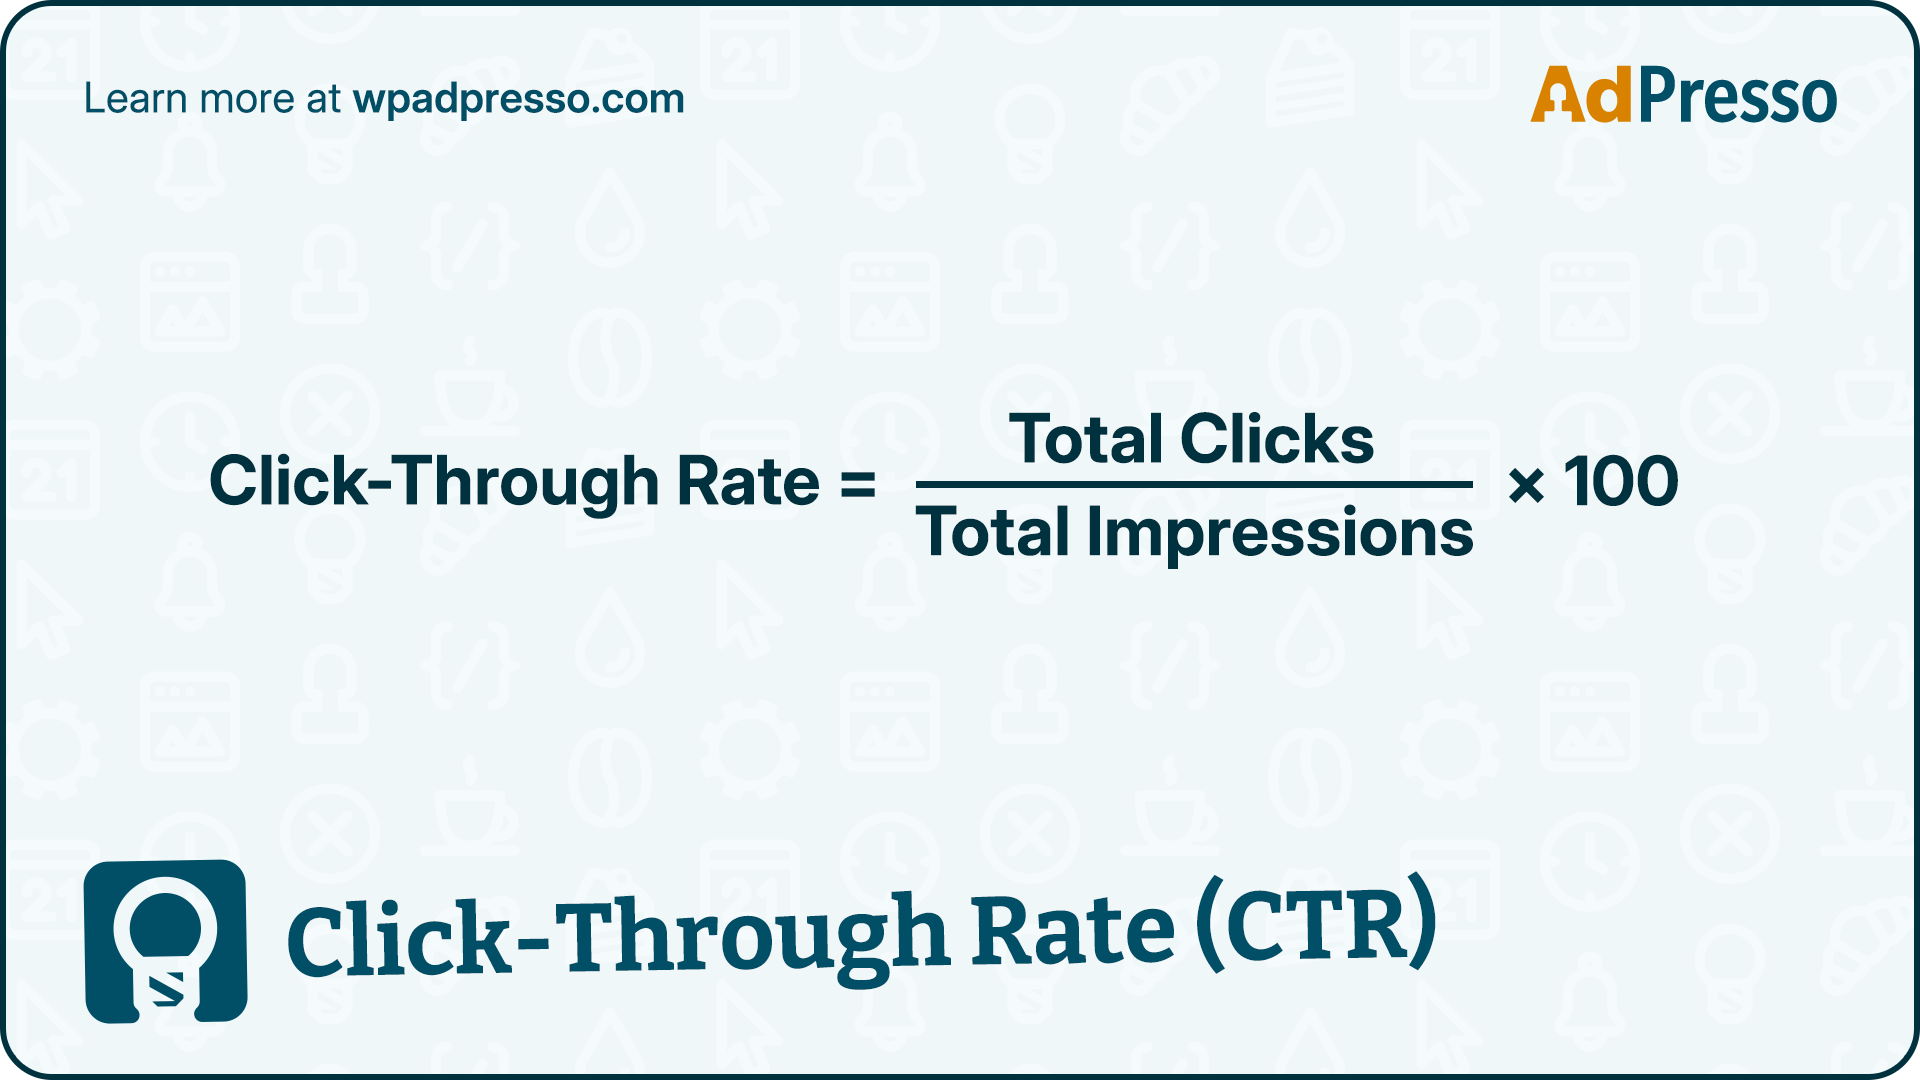
So, if your ad bags 50 clicks from 1,000 impressions, your CTR is a neat 5%.
This metric's primary goal? To tell you how good your online ad or email marketing is at sending people exactly where you want them to go, like your website. Generally, a higher CTR indicates that your campaign is doing a better job of capturing initial interest and encouraging users to take the next step.
Beyond simply indicating engagement, click-through rate holds profound importance within digital marketing.
Click-through rate offers immediate feedback on whether your content resonates. High click-through rates (CTR) signal effective headlines, messaging, and targeting; conversely, a low CTR prompts refining your copy or re-evaluating audience segmentation. This feedback loop is invaluable for iterative content improvement.
In paid advertising, each click moves you closer to a potential sale. A high CTR indicates that your campaign generates greater interest and traffic without necessarily increasing expenditure, thereby directly boosting your ROI. Low CTR campaigns typically require larger budgets to achieve comparable results, thereby diminishing cost efficiency.
Platforms like Google Ads reward high CTRs with improved quality scores. This is critical: a higher quality score can slash your cost-per-click (CPC) and secure more favorable ad content. Platforms prioritize relevant content, and a high CTR signals the pertinence of your content.
Tracking click-through rates is an indispensable part of A/B testing campaign elements, such as ad creatives or email subject lines. It provides a fast, data-driven method to pinpoint what truly clicks with your target audience, streamlining optimization for superior overall outcomes.
Click-through rates vary significantly across digital marketing channels, reflecting distinct user behaviors and platform nuances. Knowing these differences is crucial for setting realistic expectations and ad optimization
In email marketing, CTR refers to the percentage of recipients who click on any link within an email, relative to the total number of successfully delivered emails. This metric, encompassing all clickable elements, clearly shows how engaging and relevant recipients find your email content and its calls to action.
In 2025, the average email CTR across industries is around 2.0%. However, this varies: automated flows often hit 4-5%, while standard campaigns average 2-3%.
Industry-specific benchmarks highlight these disparities:
| Industry | Average Email CTR (2025) |
|---|---|
| Hobbies | 4.36% |
| Government | 4.31% |
| Media | 4.02% |
| Non-profit | 3.25% |
| Art Galleries | 3.15% |
| Bloggers | 3.23% |
| Artists | 3.24% |
| Education | 2.26% |
| Technology | 2.04% |
| Healthcare | 1.75% |
| Retail | 1.50% |
| E-commerce | 1.19% |
| Business and Finance | 1.63% |
| Marketing & Advertising | 1.11% |
| Business & Financial Services | 1.10% |
| Games | 3.75% |
| Construction | 4.55% |
| Religion | 5.11% |
| Telecommunications | 4.89% |
Note: Data compiled from multiple sources like growth-onomics. Some sources provide ranges or slightly different averages, reflecting variations in methodologies and data sets.
In social marketing, your CTR benchmarks fluctuate significantly, depending on the specific platform and the campaign's intended objectives. These clicks can happen on just about anything: image ads, video ads, carousel content, stories, or even direct links tucked into posts.
| Platform/Channel | Average CTR Range (or Median) | Notes |
|---|---|---|
| Facebook Ads | 0.90% (average across industries) | Can reach 7.13% in highly optimized campaigns; Legal & Retail around 1.6%; Beauty 0.93% median |
| Instagram Ads | 0.22%–0.88% (Feed Ads), 0.33%–0.54% (Story Ads) | Reels Ads show a 3.6% average engagement rate, Story Ads 3.1% |
| LinkedIn Ads | 0.52% (overall average) | Sponsored Content: 0.44%–0.65%; Message Ads: 3%; Conversation Ads: 12% |
| X (Twitter) Ads | 0.029% (average engagement rate per tweet) | Engagement rates dropped ~20% in 2024; Conversion rates were notably low at 0.02% |
| TikTok Ads | 0.73% (median) | Cosmetics industry median: 1.15% |
| YouTube Ads | 0.65% (average) | Gaming: 0.90%; Restaurants: 0.04%; Travel & Retail: 0.78%–0.84% |
Note: Data compiled from multiple sources. Some figures represent engagement rates rather than pure CTR due to platform reporting nuances.
Search advertising, dominated by platforms like Google Ads, typically boasts higher CTRs than display or social media. Why? Because users are actively searching for specific information or products. This signals a much higher level of intent.
| Business Category | Average CTR |
|---|---|
| Arts & Entertainment | 13.10% |
| Shopping, Collectibles & Gifts | 8.92% |
| Real Estate | 8.43% |
| Finance & Insurance | 8.33% |
| Automotive — For Sale | 8.29% |
| Personal Services | 7.69% |
| Restaurants & Food | 7.58% |
| Health & Fitness | 7.18% |
| Apparel / Fashion & Jewelry | 6.77% |
| Physicians & Surgeons | 6.73% |
| Animals & Pets | 6.58% |
| Career & Employment | 6.57% |
| Home & Home Improvement | 6.37% |
| Industrial & Commercial | 6.23% |
| Furniture | 6.11% |
| Attorneys & Legal Services | 5.97% |
| Education & Instruction | 5.74% |
| Beauty & Personal Care | 5.71% |
| Business Services | 5.65% |
| Automotive — Repair, Service & Parts | 5.56% |
| Dentists & Dental Services | 5.44% |
| Addiction Treatment | 5.9% (for #1 Search Ad) |
| Entertainment | 4.2% (for #1 Search Ad) |
| Hotels & Resorts | 3.4% (for #1 Search Ad) |
| HVAC Services | 3.2% (for #1 Search Ad) |
| CBD | 3.1% (for #1 Search Ad) |
| Higher Education & College | 3.1% (for #1 Search Ad) |
| Home Services | 2.9% (for #1 Search Ad) |
| eCommerce | 2.7% (for #1 Search Ad) |
| Home Builders | 2.7% (for #1 Search Ad) |
| Legal Services | 2.5% (for #1 Search Ad) |
| Financial Services | 2.1% (for #1 Search Ad) |
| Automotive | 1.8% (for #1 Search Ad) |
| Aviation | 1.4% (for #1 Search Ad) |
| Medical Device | 1.2% (for #1 Search Ad) |
| Construction | 1.1% (for #1 Search Ad) |
Note: Data compiled from different sources. Some data points specifically refer to the CTR for the #1 ranked search ad.
While both are crucial, click-through rate (CTR) and conversion rate measure distinct stages of the user journey. CTR quantifies initial engagement – clicks after viewing an ad or link – residing at the top of your marketing funnel. It shows if your message grabs attention.
Conversion rate, however, tracks the percentage of users who complete a desired action (such as a purchase or sign-up) after clicking and landing on your page.
A high CTR with low conversion is a significant red flag. It often means your ad is excellent at drawing clicks (perhaps even "clickbait"), but the landing page fails to meet expectations or provide value. Users click, then bounce. This signals either the wrong audience or a weak website. Conversely, fewer clicks with a higher conversion rate means genuine interest and better outcomes.
Defining a "good" CTR isn't a one-size-fits-all situation; it heavily depends on the specific marketing channel, your industry, and the type of campaign you're running. What shines as excellent in one context could be dismal in another.
Generally, these benchmarks offer a directional guide:
Optimizing CTR is a strategic blend of creativity, data, and user psychology. It demands diligent work across countless variables, with systematic testing and tracking being the absolute highest priority. This involves constantly experimenting with elements like ad layout, positioning, and audience segmentation to pinpoint what truly resonates.
Crucial areas where this systematic work applies include relentless testing and refreshing of creatives to combat ad fatigue, mandatory mobile optimization given the prevalence of mobile traffic, and diligent landing page optimization. While landing page improvements indirectly affect CTR, ensuring alignment between the ad and the post-click experience is vital.
Click-through rate (CTR) remains an indispensable metric, precisely gauging initial engagement and the immediate appeal of your digital content. It directly shows if your efforts effectively compel a click in today's noisy landscape.
Optimizing CTR is a strategic imperative. A higher CTR signals greater relevance to platforms, which directly enhances the potential for increased revenue and more efficient resource allocation across the board. This translates to improved ad monetization for publishers and greater campaign efficiency for advertisers.
However, a complete picture requires viewing the click-through rate alongside the conversion rate. At the same time, CTR measures top-of-funnel interest; a high CTR failing to convert flags a disconnect. Effective strategy, therefore, balances both to ensure clicks translate into tangible business outcomes. Mastering CTR through strategic optimization drives qualified traffic, sharpens decisions, and secures superior results.
CTR measures how often your ad or link gets clicked relative to how often it's shown. It's crucial because it indicates your content's immediate appeal and relevance to your audience. A higher CTR often means your message effectively grabs interest, leading to more engagement and potential conversions, while also improving ad quality scores on platforms.
A "good" CTR isn't fixed; it depends on the channel and industry. For email marketing, 2-4% is average, while search ads often see 3-7%. Display ads are typically lower (around 0.4-0.6%), and social media ads range from 0.9-2%. Benchmarks vary widely, so compare your performance within your specific context.
CTR measures initial interest (clicks), while conversion rate tracks desired actions (like purchases) after a click. A high CTR with low conversions signals a disconnect—your ad draws clicks, but the landing page disappoints. Balancing both ensures clicks translate into valuable business outcomes, driving qualified traffic and delivering superior overall results.