Let's start with an uncomfortable truth. An ad being delivered does not mean it was actually seen. This is exactly why the Active View Rate (AVR) exists. It tells you whether an ad actually appeared in a user's viewport, or quietly lived its entire life below the fold, in a background tab, or behind a technical wall.
In line with MRC and IAB standards, the Active View Rate is the key metric Google and programmatic platforms use to assess impression quality. In other words, AVR separates technical delivery from a real chance to be noticed. And for publishers, that distinction matters a lot.
Low viewability leads to weaker campaign performance, fewer clicks, and — sooner or later — to a lower valuation of your inventory in programmatic auctions. If nobody sees the ads, buyers will pay accordingly.
The IAB doesn't leave much room for interpretation here. An impression only qualifies as viewable if it meets precise thresholds, and those depend on the ad format
These rules exist for a good reason. They filter out so-called "ghost impressions" in which a user scrolls past too quickly before their brain even registers the brand.
The Active View Rate focuses only on impressions that are actually measurable. Anything blocked by ad blockers, browser limitations, or technical issues is excluded from the calculation.
The formula looks like this:
Active View Rate = (Viewable Impressions ÷ Measureable Impressions) × 100
If 100 impressions were technically measurable, but only 60 met the IAB's "50% for one second" rule, your Active View Rate is 60%.
One important thing to keep in mind: Google can't evaluate every single impression you serve. Before it can judge an ad unit as "viewable," it must first be measurable. And that's where things sometimes fall apart.
Cross-domain iframes, outdated browsers, background tabs, or ad blockers can all prevent Google from collecting visibility data. If the tracking script can't see the ad, it can't assign a score. No data, no judgment.
Google classifies ad impressions in AdSense and Ad Manager using these specific categories:
| Eligible Impressions | These are the total ad calls where Active View tracking is technically possible. |
| Measurable Impressions | These are the ones where the tracking actually worked and collected data. |
| Viewable Impressions | The "winners"—ads that hit the IAB standards (50% pixels for 1 or 2 seconds). |
Ad placement heavily influences visibility. Across the industry, display ads typically have an AVR of 50% to 70%. Well-placed above-the-fold ads often reach 70% to 85%, simply because users see them without scrolling. Footer placements or fast-scrolling mobile feeds? They usually struggle to break 50%.
But placement isn't everything. The type of website matters just as much. Premium sites with long-form content, clean layouts, and focused users often achieve 70% to 90% viewability. High dwell time does wonders here. News portals and social platforms, on the other hand, usually sit around 50% to 60%. Fast scrolling, content overload, and higher ad-blocker usage take their toll.
| Category | Industry Avg. | Premium Sites | News/Social |
|---|---|---|---|
| Display (Desktop) | 65-75% | 80-90% | 55-65% |
| Display (Mobile) | 50-60% | 65-75% | 40-55% |
| Video (In-Stream) | 70-80% | >85% | 60-70% |
| Video (Out-Stream) | 60-70% | 75-85% | 50-65% |
Here's a fun fact that surprises many publishers: EMEA is currently the global leader in video viewability. With an average rate of around 80%, Europe, the Middle East, and Africa outperform every other primary market right now. A major driver of this momentum is Sub-Saharan Africa, where ad volume has recently quadrupled. More inventory, better tracking, and improved infrastructure are clearly paying off.
That said, not everything lifts the regional average. Mobile web display ads are holding EMEA back a bit. Even though they make up nearly half of the available inventory, their viewability sits at roughly 66%. High volume doesn't automatically mean high quality, especially on mobile.
The following data compares Active Views Rates across different parts of EMEA:
| Region | Average viewable rate | Video viewable rate | Display viewable rate |
|---|---|---|---|
| Central Europe | 68% | 80% | 65% |
| Eastern Europe | 61% | 78% | 53% |
| MENAT Region | 71% | 80% | 63% |
| Southern Europe | 63% | 82% | 62% |
| Sub-Saharan Africa | 68% | 78% | 65% |
| Total EMEA | 70% (+3% YoY) | 80% (+5% YoY) | 66% (+6% YoY) |
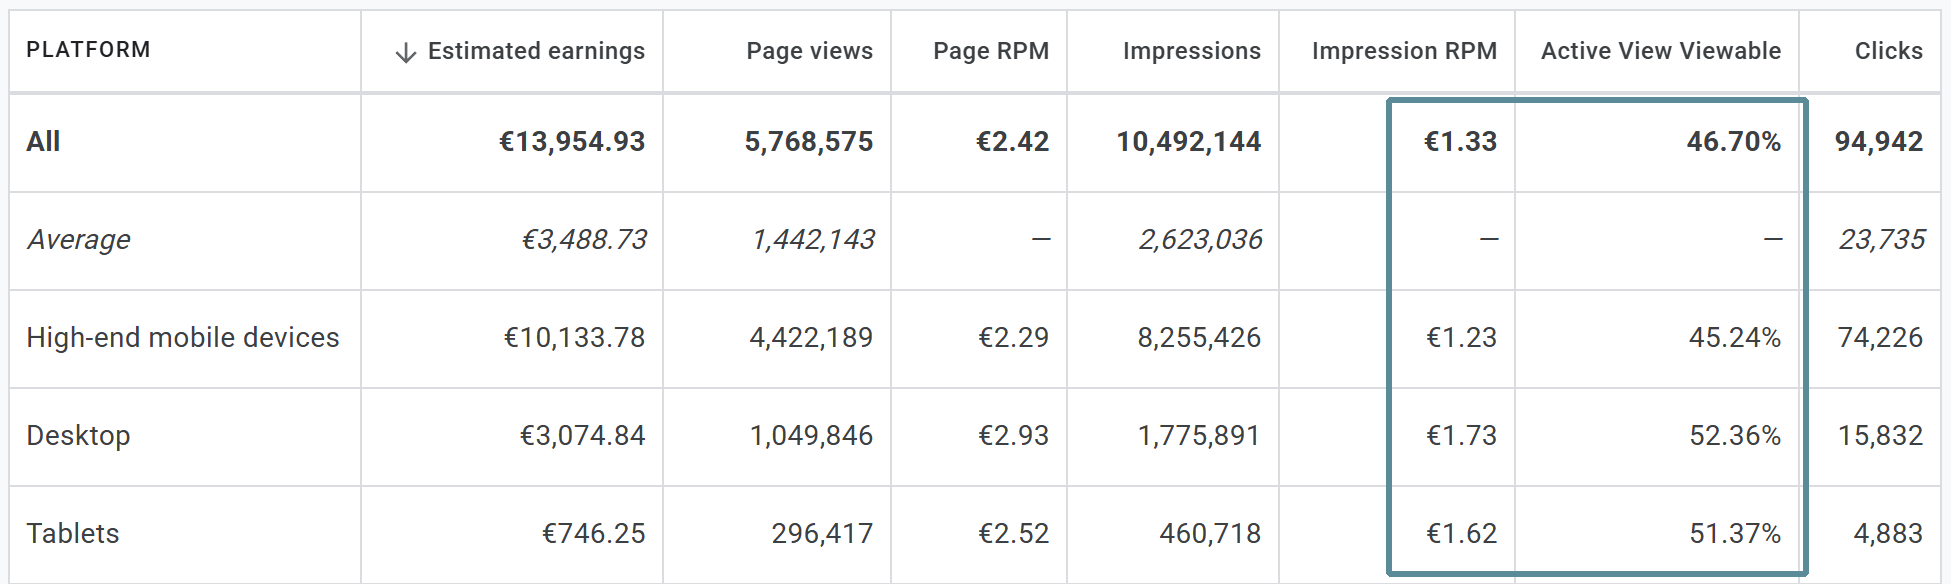
The device your audience uses plays a huge role in how long ads stay visible. User behavior on desktops looks very different from that on mobile, and the numbers reflect that.
Desktop environments are still the calm, reliable ones. Bigger screens. Longer sessions. Less frantic scrolling.
In 2024:
The larger screens make it easier for ads to meet Ad Viewability criteria.
Mobile is where volume lives. But viewability has to work harder. Mobile devices generate around 70% of all display impressions, yet fast scrolling often cuts visibility short before ads hit the one-second mark.
Here's how things break down:
| Placement and format | Active View Rate |
|---|---|
| Mobile web video | 82.4% |
| Mobile display ads | 68.4% |
| In-app placements | 74.2% |
One practical fix? Go vertical. Formats like the 300×600 skyscraper stay in view longer. Their height keeps them anchored in the viewport and can boost viewability by roughly 22% compared to classic 300×250 rectangles.
And one crucial reminder: Treat benchmarks like a compass, not a fixed map. Always sanity-check these numbers against your own data in Google Ad Manager, Google Ads, or tools like AdPresso.
Ever wondered how Google actually knows whether someone saw an ad? No magic involved, it all happens directly in the user's browser. That is what we call client-side measurement.
As soon as a page loads, small JavaScript snippets, specifically Google Publisher Tags (GPT), get to work. They monitor the ad's position in real time and compare it to the viewport.
Here is the play-by-play of how Google handles it:
All of this data ends up neatly organized in Google Ads or Google Ad Manager. You can break it down by placement, device, or format to see precisely where your setup shines and where it needs work.
For advertisers, viewability data unlocked a powerful bidding model: vCPM (Cost per Viewable Mille). Instead of paying for every impression that technically loads, advertisers only pay for impressions that are validated as viewable.
If your site runs on WordPress, here's the good news. You don't need a heavyweight enterprise setup to keep an eye on your Active View Rate. With a tool like the AdPresso Pro plugin, you can monitor viewability metrics directly inside your WordPress dashboard.
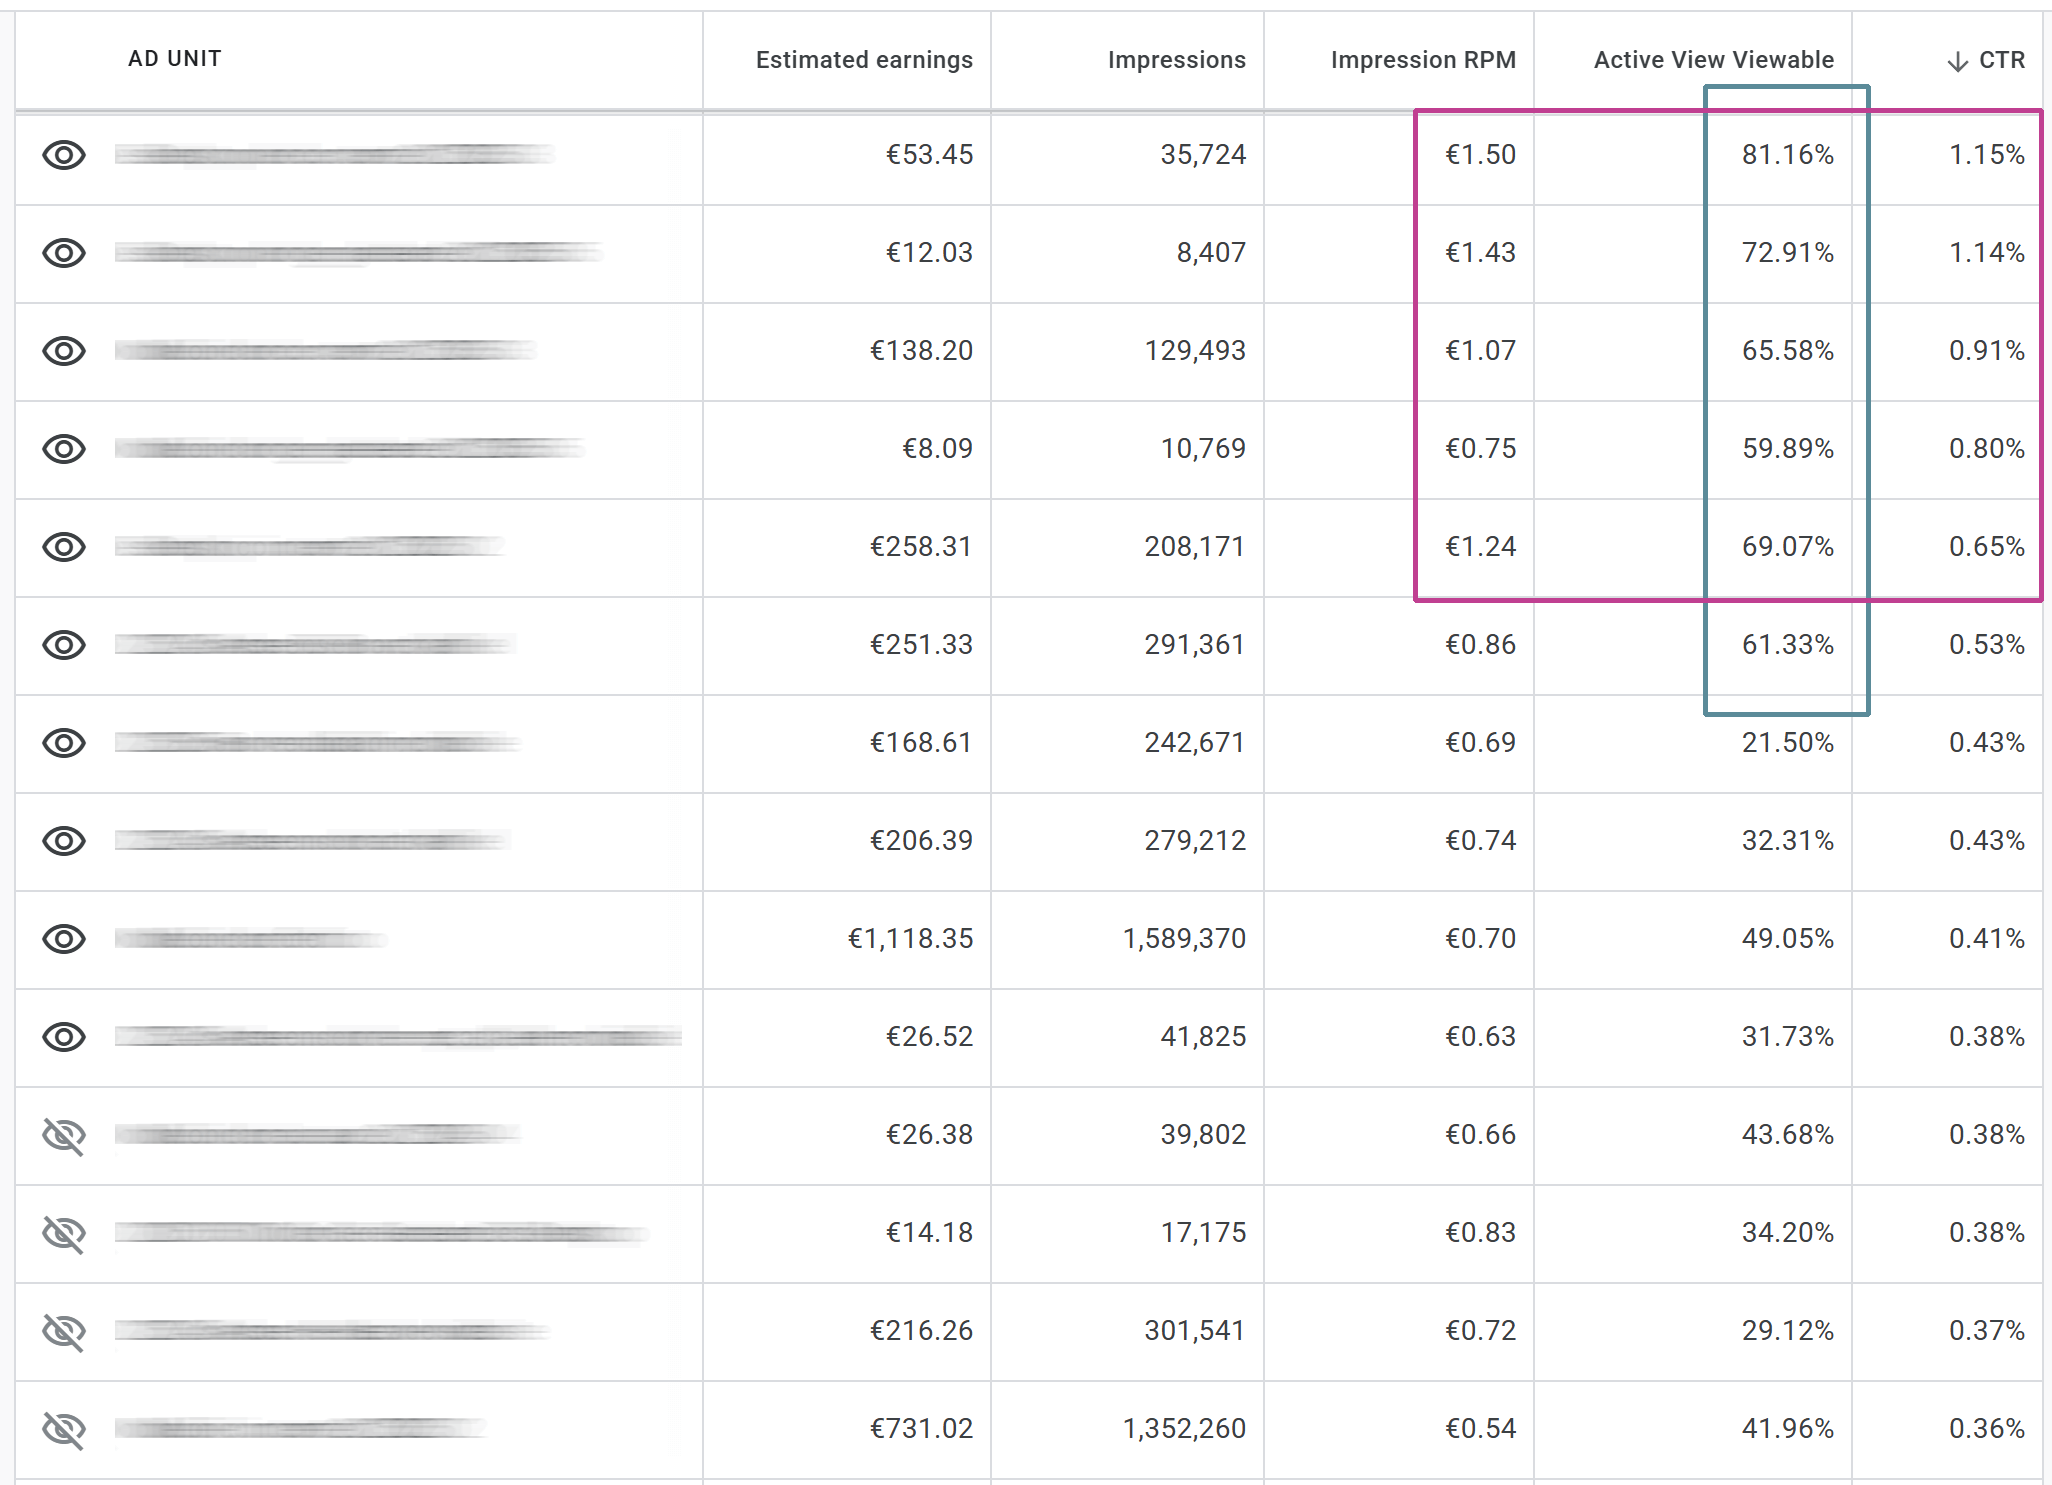
What makes this especially useful is that AdPresso measures visibility on two different levels:
This level of detail is a real lifesaver when something isn't working. Low viewability could mean the banner design is simply easy to ignore. Or it could be the placement, like an ad sitting politely at the very end of a long article that most readers never reach.
Once you know where your dead zones are, you can act. Move ads to better-performing spots, clean up weak placements, and stop wasting excellent inventory.
From an advertiser's perspective, the Active View Rate is the fastest way to cut ad waste. Let's be honest, an invisible ad can't drive clicks, leads, or sales. It just burns the budget quietly in the background. That's precisely why your visibility score directly impacts your revenue. Most advertisers actively prioritize publishers who can deliver a stable AVR above 50%.
If your viewability consistently falls below that line, advertisers might exclude your website from premium branding campaigns. Big brands want attention, and they won't pay for placements hidden in the shadows.
In programmatic advertising, the Active View Rate is one of the strongest levers you have to increase eCPM.
Visibility and revenue are tightly connected. Inventory with an AVR above 50% often generates significantly higher income than poorly placed ads. Why? Because higher viewability attracts more bidders and stronger competition drives prices up.
This obvious rule doesn't just apply to programmatic setups. Even with classic banner ads or affiliate placements, viewability is essential. An ad can only generate clicks or conversions if it actually enters the user's field of vision.
High visibility scores also strengthen your position in direct sales. When you can prove viewability, you can price placements more confidently and forecast click-through rates more accurately. The conversation shifts away from theoretical impressions and toward measurable results. And that's where monetization starts to feel a lot more predictable, and a lot less guessy.
It is worth repeating. Users cannot consciously click on something they cannot see. Multiple studies from industry heavyweights like Google and Nielsen confirm this. The Active View Rate is one of the strongest predictors of click-through rate and overall performance.
The data reveals some very clear tipping points:
High viewability creates the opportunity for success, but it is not a guarantee. If an ad has excellent visibility but zero engagement, the issue is usually the creative or the targeting. On the other hand, a sudden spike in clicks combined with poor viewability is a strong warning sign. In many cases, these point to accidental clicks or ad fraud.
As a general rule, once you cross the 70% AVR threshold, conversion performance tends to increase noticeably.
In programmatic advertising, the Active View Rate is one of the strongest drivers of eCPM. High-visibility inventory attracts more bidders. More bidders increase competition. More competition pushes prices up. That is why well-placed ads often generate up to twice the revenue of placements hidden from view.
Demand side platforms use machine learning models to evaluate placement quality in real time. Low performance scores trigger automatic bid reductions or the removal of placements from auctions altogether. When that happens, your inventory slowly slides down the programmatic hierarchy. The result is fewer bids, weaker demand, and lower prices per impression.
Most large advertisers also define strict viewability thresholds for their campaigns. If your site fails to meet these standards, advertisers and media buyers might automatically exclude you from premium branding budgets. Without access to these high-value campaigns, publishers are left with remnant demand in open auctions, which often results in lower fill rates and reduced revenue.
A low Active View Rate is a clear signal of inefficient ad placements. When ads load in the background and never enter the viewport, they create ad waste. These impressions still consume resources. They increase page weight, slow page load times, and degrade the user experience. But they generate no revenue in return.
Removing these invisible placements improves site speed and overall quality. Even more importantly, it ensures that every ad you load has a real chance to be seen.
The goal is simple—place ads where they naturally fit into the content flow and stay in view long enough to register. Time in the viewport is the name of the game.
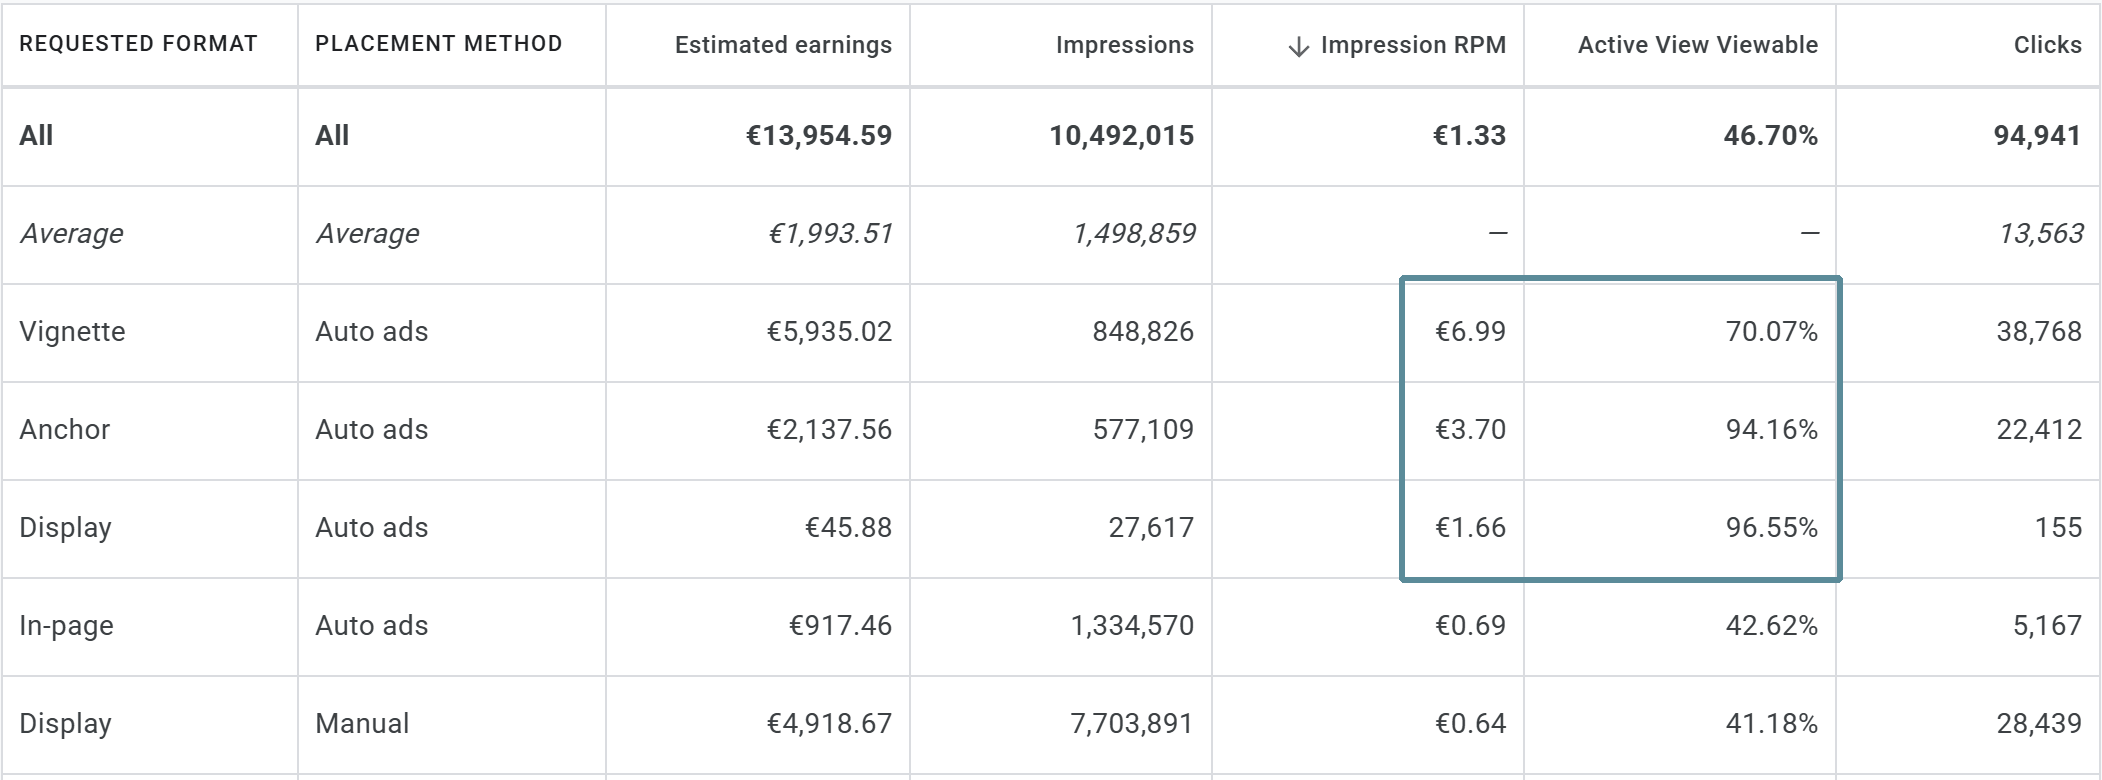
Some placements are visibility champions. Others struggle no matter how good the creative is.
Above-the-fold placements are still the strongest performers. Because they appear immediately on page load, they typically reach 70% to 90% viewability. Instant visibility makes a big difference.
Inside the content, sticky ads can be real AVR boosters. Since they remain fixed while users scroll, they often increase visibility by 20% to 30% compared to static placements.
Large vertical formats, such as the 300x600 half-page, consistently outperform horizontal banners. Vertical scrolling keeps these ads in view longer, which naturally improves Active View performance.
You can have the perfect placement, but if your page loads slowly, you have already lost. Think about your own browsing behavior. If a page feels sluggish, you start scrolling immediately to get to the content. When the ad finally renders, you are already past it. The impression technically loads, but it never had a real chance to be seen.
That is why site speed is a direct driver of Active View Rate. Faster pages mean ads render earlier. Earlier rendering means more time in view.
Lazy Loading is one of the most effective technical optimizations you can implement. Instead of loading all ads at once, Lazy Loading triggers the ad request only when a user scrolls close to the placement. This simple shift dramatically improves the ratio between loaded and viewable impressions. Why? Because ads that users never reach are never loaded. And impressions that never load cannot hurt your AVR.
For WordPress publishers, tools like the AdPresso plugin offer built-in Lazy Loading features specifically for ad units. The process runs automatically in the background, keeping your site fast and ensuring every impression represents a genuine opportunity to be seen—less waste. Better viewability. Stronger monetization.
Effective optimization always starts with data, not gut feeling. Google Ad Manager and AdSense provide detailed Active View reports that show you exactly which placements consistently fall below industry benchmarks. These weak spots do more than underperform. They drag down your overall account average and make your inventory less attractive to buyers.
If you really want to squeeze the most out of your layout, A/B testing is non-negotiable. Compare a classic header leaderboard with a sticky sidebar placement. Test a horizontal banner against a vertical format. You will often discover that even small changes in position or size can noticeably improve viewability without disrupting the reading experience.
The goal is to find that sweet spot where ads are clearly visible, but never in the way.
To take things a step further, consider combining header bidding with viewability filters. This setup allows premium demand to compete specifically for your high-visibility placements.
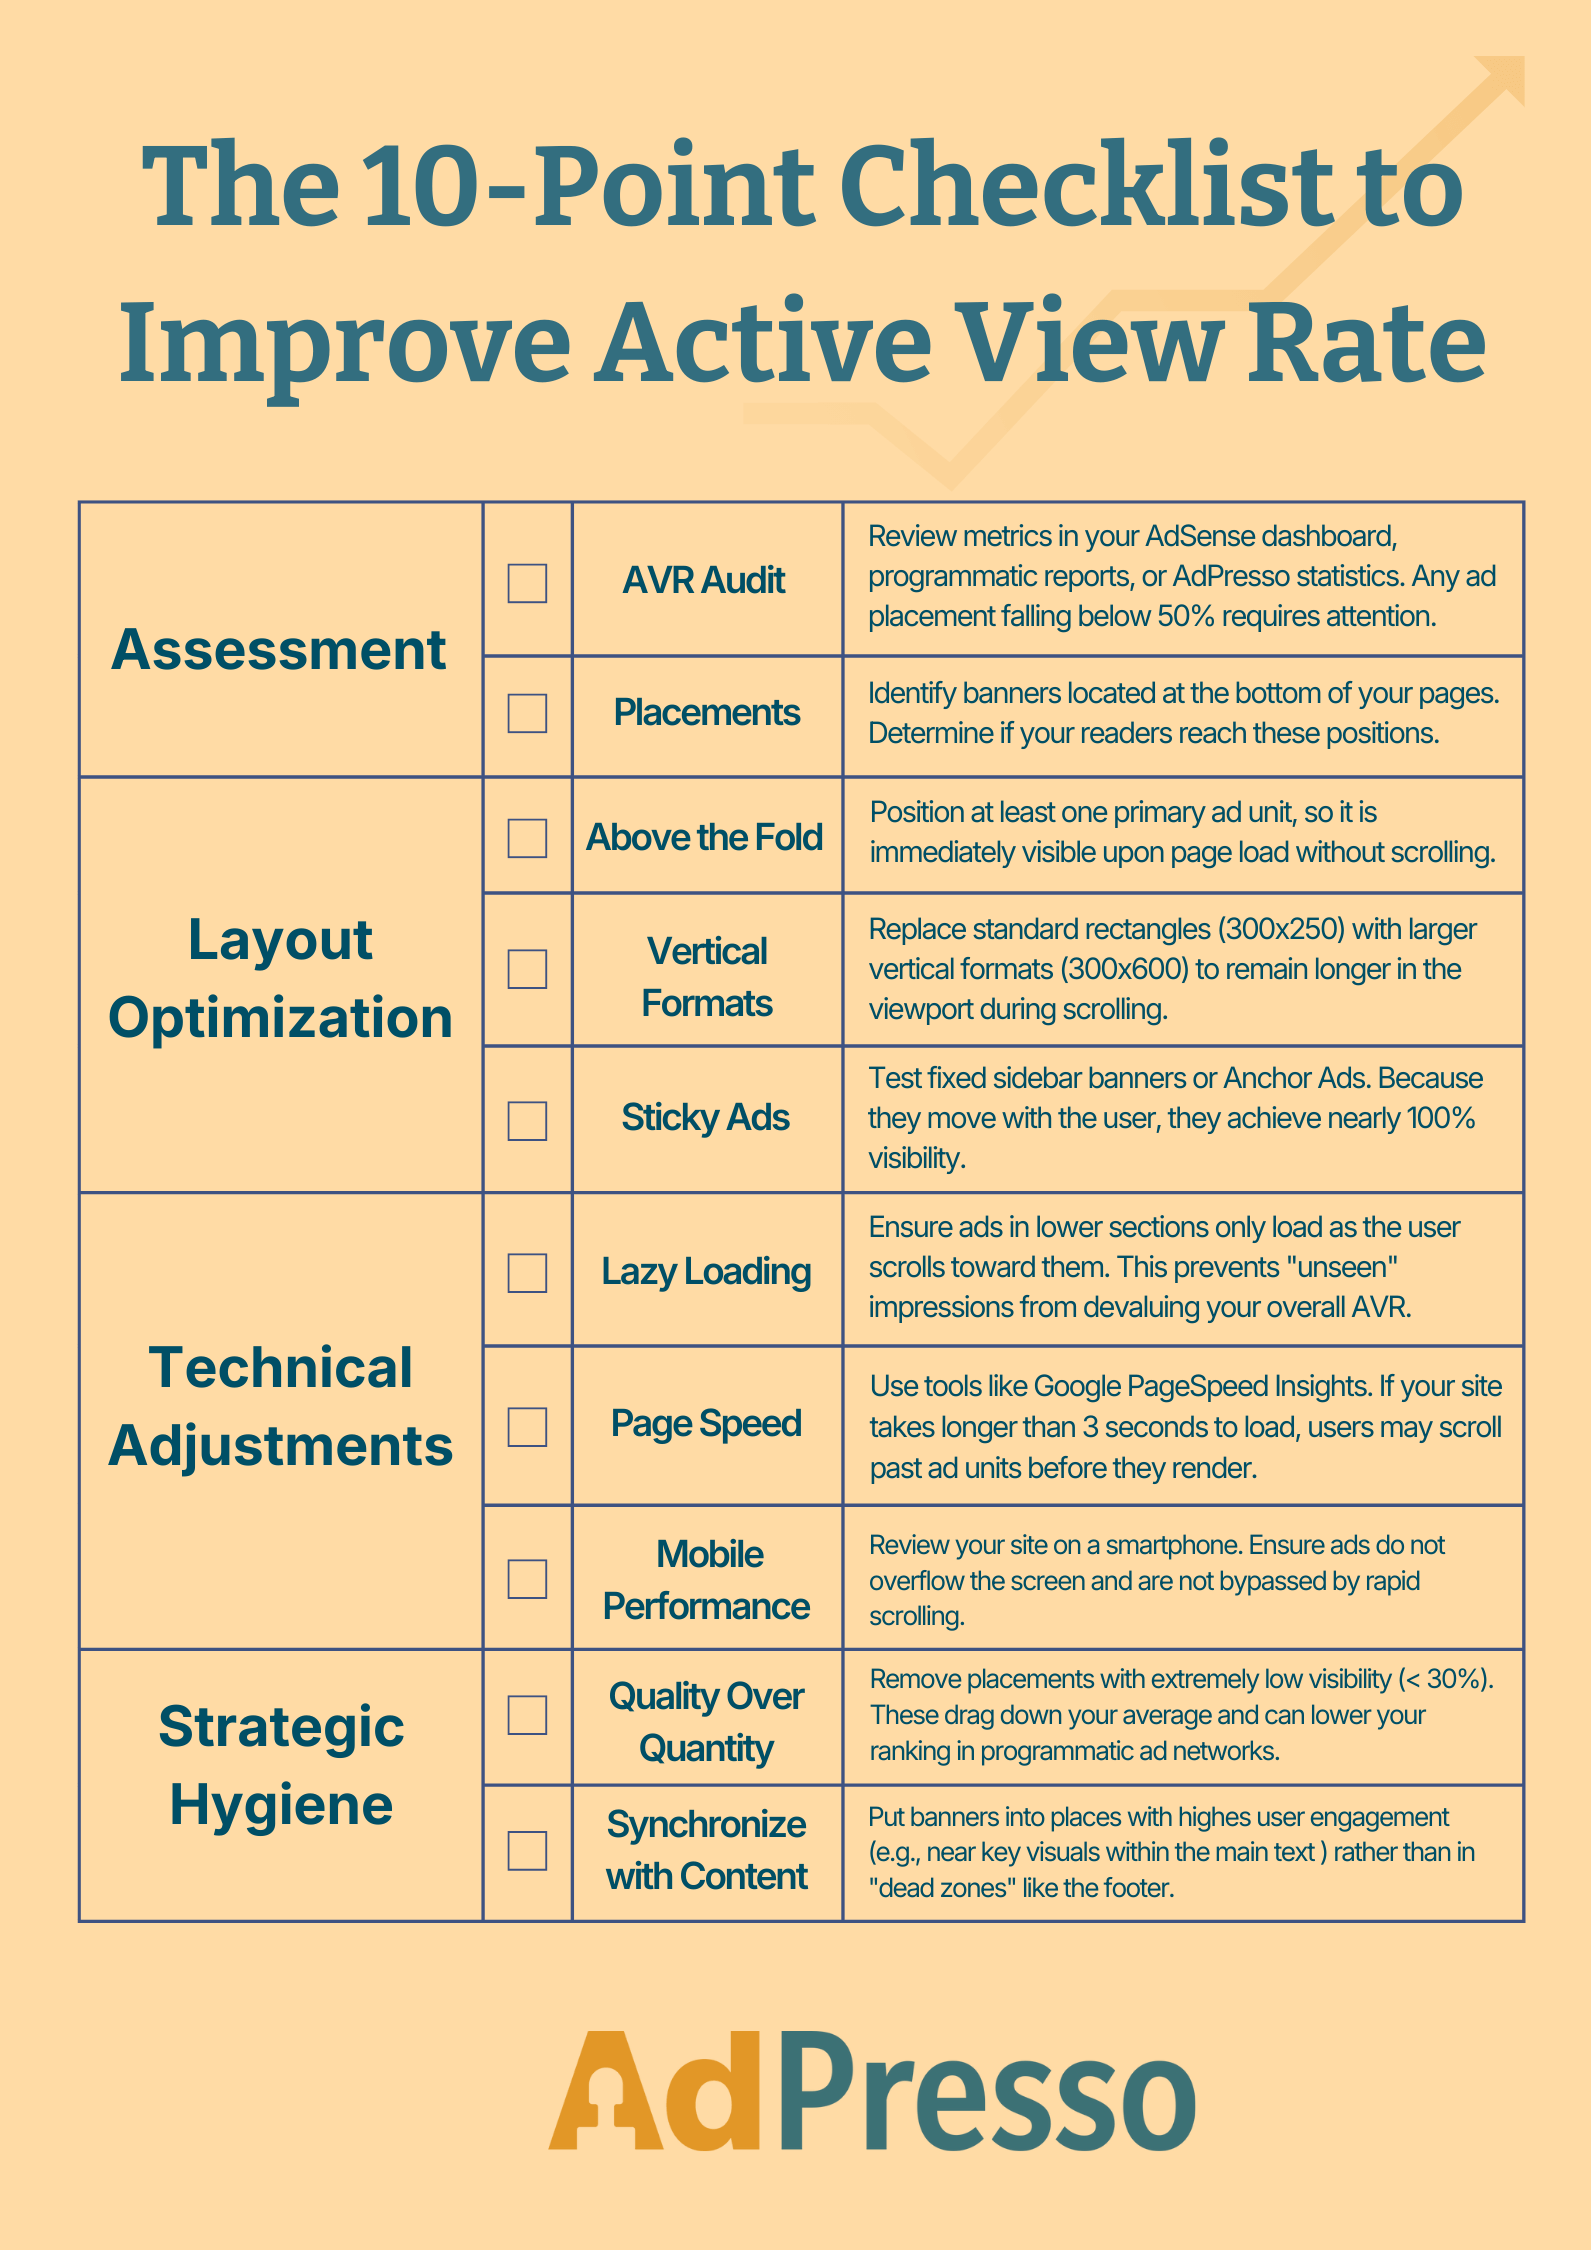
The most powerful optimization levers live directly on your website. High viewability is mainly driven by layout decisions and technical setup, not by adding more ads.
I designed the following checklist to help you implement on-page optimizations to increase your Active View rate and sustainably improve your inventory quality.
The toolkits for measuring viewability are undergoing a fundamental transformation. Privacy regulations and new technology are reshaping the rules, and publishers who adapt early will have a clear advantage.
With third-party cookies disappearing and GDPR enforcement getting stricter, tracking users across the web is no longer a realistic option. For publishers, this means a shift back to what actually works long term: context.
Instead of following users, monetization strategies are moving toward contextual targeting. Ads will align with the topic a user is actively reading, not with who that user is. It is privacy-compliant, transparent, and surprisingly effective. This approach becomes even more powerful when combined with first-party data, such as newsletter subscribers or logged-in users. Together, context and first-party signals are becoming the foundation for stable revenue in a post-cookie world.
The industry is also moving beyond simple visibility. Traditional viewability metrics only confirm that a browser rendered pixels. New standards go further. Concepts like attention quality scores and dwell depth measure whether users actually noticed and processed an ad. This shift changes how ad space is valued. Time on screen matters, but engagement intensity matters more.
For publishers, the implication is clear. High-quality content, thoughtful layouts, and non-intrusive ad experiences are no longer just nice-to-haves. They are the currency that unlocks premium advertising budgets.
Artificial intelligence is turning viewability from a reactive metric into a predictive signal. Therefore, modern demand-side platforms now use machine learning to estimate visibility and attention within milliseconds before a bid is even placed. These models analyze real-time signals like scrolling behavior, device type, and historical performance patterns. The result is dynamic pricing based on the predicted value of each impression.
Advertisers benefit from lower acquisition costs. Publishers benefit when they can prove the predictive quality of their inventory. High-quality placements can be priced more aggressively, even before the ad loads. And that is where monetization is heading. Not just being seen, but being predictably worth seeing.